API St 2560:2003(2010) pdf download
API St 2560:2003(2010) pdf download.Reconciliation of Liquid Pipeline Quantities.
6.5.6 Meter factors usually behave in a predictable way. If operating conditions are essentially constant and wear is not excessive. meter factors may be plotted on conventional control charts with warning, action and tolerance limits. However, if meters are subject to variabk operating conditions and/or liquids with ditkrent physical properties. their control charts will exhibit enough natural variation to dilute the valuc of warning and action limits.
6.5.7 Meter factor patterns on control charts should he reviewed to determine if a meter (I is about to go out of tolerance or (2) is developing an abnormal pattern or trend. If either of these occurs, the mcter should be inspected for wear or damage. Some companies set a fixed meter factor tolerance for mandating meter repair.
6.5.8 For multi-functional meters. interpretation of control charts is not straight forward. The patterns on the charts are composites of several sub-patterns which are dictated by how rate, temperature. pressure and liquid properties. Insofar as possible, the data for such meters should be broken into separate plots of meter factor segregated by one variable, such as liquid type, with other conditions being as nearly constant as possible.
6.5.9 Even when charts arc broken out by crude type. conventional control charts may not be adequate, because in order to get enough data with one crude type. it may be necessary to accumulate single meter factors or small groups of meter factors for a given crude which are separated from each other by significant lengths of time. As a result, each subsequent factor or group of factors may he affected by meter use and wear between factors. This leads to a trending situation, and trending charts may be required to depict the data.
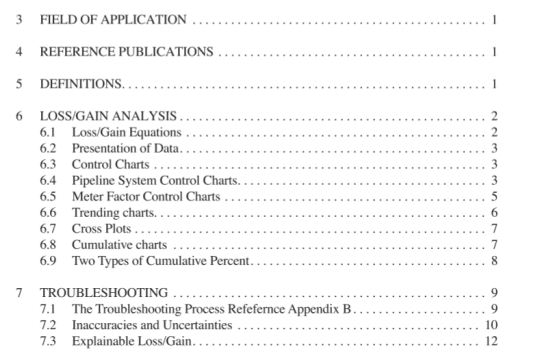
6.6 TRENDING CHARTS
6.6.1 Trending charts may be used when data exhibit a definite upward or downward trend and do not hover around a simple horizontal mean value. Such charts may be shown as a trending run chart merely to show a trend in the data, or may resemble a control chart with lines representing average performance similar to ‘mean’) and control limits that follow the upward or downward trend of the data.
6.6.2 Meter tictor charts arc often (rending charts, as meter factors generally tend to increase in a regular Ilishion with time due to wear in a meter.
6.6.3 An example of a trending coiitrol chart is shown on Figure X,
6.7.5 Sometimes it is helpful to know how much two sariabks interact with each other. One sariable is the “independent variable” and the other is the “dependent variable”. The value of the dependent variable depends on the value of the independent variable. In other words, the dependent variable will change every time the independent variable changes. If the dependent variable is changed by some other influence. the independent variable will not change as a result. For example. a meter factor can be changed by changing flow rate. hut flow rate cannot be changed by changing meter factor.
6.7.6 The relationship between two variables is called the “correlation” and may be “strong”, in which case the dependent variable changes in a very predictable manner with changes in the independent variable, or may be “weak”, in which case the dependent variable tends to change with the independent variable hut the amount of change is not predictable.
6.7.7 The strength of the correlation can be measured statistically with the “correlation coefficient”: The procedure for calculating the correlation coefficient is shown in Appendix A.
6.7.8 It should be noted that even though a strong correlation exists, if the slope of the associated regression line is very flat the correlation is relatively insignificant.
6.8 CUMULATIVE CHARTS
6.8.1 Cumulative charts are similar to trending charts but plot the cumulative values of some variable such as, hG vs. time. i’he cumulative value is oNained by arithmetically (i.e.. keeping the plus and minus signs) ackling the value of each data point to the sum of all the data points preceding it in a sequence of data.
6.8.2 The data in cumLalative charts do not hover around a central mean value. They exhibit an upward or downward trend. The shape of the curve is the main characteristic of cumulative charts, and changes in shape or general trend are very important.


